
SaberStat data collection | November 2023
One of the projects that I have been working on lately has been a Lightsaber battle hit/miss tracker for the Apple Watch. The project originally started in November 2023, but got shelved for a while as I worked on tra86 and STORMM. I restarted it about 3 weeks ago, with a better understanding of how to build for Apple Platforms and general comfort in Swift.
This blog post isn’t so much about SaberStat the product, as much as it is about a step towards determining a hit detection algorithm for the app itself. Frank and I collected some data back then using a mini “Sensor Logger” app (shoutout Kelvin Choi) on the Watch that would send data over HTTP using POST requests.
A running HTTPD server on our respective laptops would use a Python script to collect this data and put it into a fancy CSV (which I cobbled up in 25-ish minutes, outside, during Amherst winter). If you’re interested in how this was done, feel free to read the post I wrote on the earlier (now-archived) version of this website. Kelvin’s approach to log X, Y, Z data for each sensor was also incorporated in the first (alpha) version of the app, which I had in about March 2024 (though the iPhone screenshot is a dummy, and the watch app just did what Kelvin’s app did but worse):
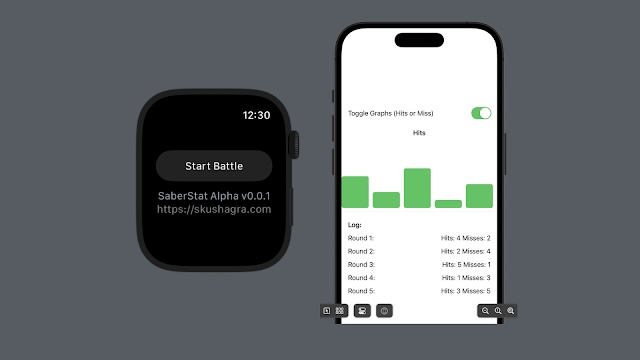
UX design is my passion
(old 2023 screenshots, current design complete and releasing soon)
At the end of the data collection, we had CSV files spanning multiple lightsaber battles, and CSV records with the following headers transmitted at a frequency of 100Hz:
time, seconds_elapsed,
rotationRateX, rotationRateY, rotationRateZ,
gravityX, gravityY, gravityZ,
accelerationX, accelerationY, accelerationZ,
quaternionW,quaternionX,quaternionY,quaternionZ

The full CSV files will be Open Sourced soon, enjoy this screenshot
Kowalski, Analysis

So with all the data collected and conveniently forgotten about for a couple of years, it was time to analyze it and find some patterns that help us build a hit detection algorithm on the Apple Watch. Intuitively, the baseline naive approach here is to calculate the rate of change/direction of acceleration (positive jerk), and a peak/sharp change in jerk (positive snap) would denote a hit at that moment. This can easily be done if we take the magnitude of acceleration in the x, y, z planes (aka apply the Pythagorean Theorem in 3D space); and we differentiate that with regards to time. To calculate snap, we differentiate it again with respect to time.
***However, the issue at hand is that a jerk is also recorded when you wave a lightsaber, or swing it the other way during a battle. Not every peak in jerk recorded is a valid hit. There has to be some way to take the other metrics into account to denote how a hit is possible.
One of the ways to think about a successful lightsaber hit is to merge the acceleration metrics with the rotational metrics. Basically, when there is a change in direction/acceleration alongside a change in the rotation of your wrist (because a lightsaber just struck yours or vice versa), we can imagine that you have a successful lightsaber hit. On the other hand, if a peak in jerk was recorded without a peak in the rotation of your wrist, we can imagine that you had a swing and a miss.
So, during a successful hit, the watch experiences:
- A sudden stop (high deceleration)
- A rotational jolt (wrist suddenly changing direection)
- All in the span of 50-100ms
This means, we can safely ignore the gravity and quaternion data for the time being. For the purposes of this blog post, I will only take one of my datasets and work with it: the 2nd one taken on Frank’s Apple Watch Series 8. This is a relatively small dataset: only 30 seconds and 1825 samples.
Plotting just the acceleration & rotation in all three dimensions alongside their respective magnitudes:

The raw data (top two plots): Chaotic. The big spike around t=22s shows up mostly in Y (orange) for acceleration, but the rotation spike is split across all three axes. If you were thresholding on just one axis, you’d miss hits or get inconsistent detection depending on wrist orientation.
So far, we have great data, and I was retrospectively very impressed by the sensors on this tiny device gathering such clear data. Since the watch can be worn in any direction, calculating acceleration or rotation in any one direction is essentially meaningless. The fix is magnitude:
magnitude = sqrt(x2+y2+z2)
Once you plot magnitude, hits visually appear as spikes.
The magnitudes (bottom two plots): That massive peak at t=22s jumps out immediately: roughly 14g acceleration with 18 rad/s rotation. That’s unambiguously a hit.
Rotation magnitude has a “baseline hum” during active periods (around 3-5 rad/s) even when acceleration is low. That’s swinging without impact. This is exactly why you need both thresholds: high rotation alone isn’t a hit, high acceleration alone might be dropping your arm. You need the conjunction.
The quiet periods (0-5s, 10-15s, 25-30s) show near-zero on both magnitudes. Good signal-to-noise ratio.
Once we have the magnitudes, we need to combine the accelerational and rotational magnitudes to a heuristic & find peaks in them to denote a hit. You could write your own peak finder:

Or you Google “find peaks in time series python” and discover scipy.signal.find_peaks, which handles edge cases like minimum distance between peaks (debouncing) and prominence (filtering small bumps). You plot your data with detected peaks overlaid, see if they match where hits actually occurred, and adjust. There’s no formula – it’s tuning by inspection. At the end of it, you get some really cool-looking plots:

A little code dive
SaberStat will be Open Source under MIT, but the repository itself is private until I am still working on it, and haven’t released on the App Store. I have taken segments for this blog post, and made a gist if you want to follow along.
The two functions that do the heavy lifting are compute_features and find_potential_hits. Let’s walk through them.
compute_features takes the raw CSV data and derives the metrics we actually care about:

We just talked about the acceleration and rotation magnitudes - nothing fancy. Jerk is where it gets interesting: it’s the derivative of acceleration magnitude with respect to time. Jerk captures the sharpness of a stop, not just its intensity. A smooth deceleration has low jerk; slamming into another lightsaber has high jerk.
The impact score is a weighted combination of all three: acc_mag * 0.6 + rot_mag * 0.3 + jerk * 0.0001. These weights are empirical: I eyeballed the plots and tuned until the detected hits matched what I remembered from the actual battles. Acceleration dominates, rotation confirms, jerk is a tiebreaker.
find_potential_hits is where the actual detection happens:

This is a two-stage filter. First, scipy’s find_peaks finds all local maxima in acceleration magnitude that exceed a threshold. The distance parameter handles debouncing: if we assume ~100Hz sample rate, a 200ms debounce window means ignoring peaks within 20 samples of each other. This prevents a single hit from registering multiple times as the sensor rings down.
Second, we filter those peaks by rotation threshold. This is the conjunction I mentioned earlier: high acceleration and high rotation together indicate a hit. High acceleration alone might be you dropping your arm. High rotation alone is just swinging. You need both. Bringing it all together in main():

The first part of the command line outputs for each dataset are the thresholds that interactive_threshold_tuning prints. This function doesn’t actually do anything to the data – it just tells you what you’re working with. The min/max ranges for acceleration and rotation give you a sense of scale, and the suggested thresholds (95th percentile for acceleration, 90th for rotation) are a reasonable starting point (by vibes). The idea is: if a spike is in the top 5% of acceleration values, it’s probably not just normal movement.
The second part of the command line output shows the analysis from analyze_hits(). This is the payoff: how many hits were detected, and what they look like statistically. The function reports the total sample count, recording duration, and detected sample rate (sanity check: we expected ~100Hz, and that’s what we got).
The hit statistics tell you whether your thresholds are in the right ballpark. If the mean acceleration magnitude at detected hits is barely above your threshold, you’re probably catching noise. If the max is 5x your threshold, you’ve got clear signal. The timestamps at the end let you cross-reference against the plot - you can eyeball t=22.15s on the graph and confirm that yes, that massive spike got flagged.

Which concludes our little data wrangling experimentation. I’ll keep the updates to SaberStat coming, alongside an App Store release for the Watch app in the next couple of months!!